Parent info
Parts you need
Affiliate links — we may earn a small commission
Try this circuit in your browser!
Run the code, press the buttons and watch what happens — before you buy any parts. No account needed.
Open in Simulator →Your classmates counted bubbles. You graphed the complete metabolic curve.
Imagine this: AP Biology, cellular respiration lab. Fermentation experiment — yeast, sugar, warm water. Everyone counts CO2 bubbles through an airlock and estimates activity level. “Lots of bubbles” = “yeast is active.” Qualitative.
Your setup: a sealed flask with yeast and sugar. An MH-Z19B CO2 sensor measures CO2 concentration inside the flask. A DS18B20 records temperature. Every 30 seconds, the ESP32 logs both. You run the experiment for 2 hours and get a graph: CO2 starts at 400ppm (atmospheric baseline), climbs to 4,000+ ppm as fermentation peaks, then levels off as glucose is depleted.
You can see fermentation start, peak, and stop. With numbers.
That’s what we’re building. For about $28.
What you’ll need
| Part | What it does | Price |
|---|---|---|
| ESP32-S3-DevKitC-1 | Brain — reads sensors, logs data, serves web | ~$12 |
| MH-Z19B CO2 sensor | NDIR (infrared) CO2 sensor: 0–5000ppm, accurate | ~$12 |
| DS18B20 waterproof probe | Logs temperature alongside CO2 | ~$4 |
| Breadboard + jumper wires | Wires it all | ~$5 |
You also need: 4.7kΩ resistor (for DS18B20), sealed container (mason jar), yeast (active dry), sugar, warm water, silicone tubing (connects jar to sensor).
Total: ~$28 | Time: ~3 hours | Difficulty: ●●●●○
How it works (60 seconds)
The MH-Z19B is an NDIR (Non-Dispersive Infrared) CO2 sensor. It shines an infrared light through a chamber — CO2 molecules absorb IR at a specific wavelength (4.26μm). More CO2 = more absorption = sensor reads higher ppm.
This is the same technology in professional environmental monitoring equipment. It communicates via UART (serial) — more reliable than analog sensors.
Fermentation: glucose → ethanol + CO2. More CO2 in the sealed flask = more fermentation activity. The sensor tracks this in real time.
Step 0: Set up the experiment
Time: ~30 minutes
Prepare fermentation flask:
- In a 500mL mason jar, mix:
- 250mL warm water (35–38°C — check with thermometer)
- 10g sugar (2 teaspoons)
- 5g active dry yeast (one packet)
- Stir to dissolve
- Make two holes in the lid: one for the CO2 tube, one for the DS18B20 probe
- Seal both holes with putty or silicone sealant
- Connect a short tube from the jar to the MH-Z19B sensor inlet
Seal is important: If the jar isn’t sealed, CO2 escapes and the sensor reads atmospheric levels. A good seal means CO2 builds up inside.
Alternative if sealing is difficult: Use a food storage bag — seal the yeast mixture inside with the CO2 sensor, leaving enough space for expansion.
Variables to test:
| Condition | Change |
|---|---|
| Glucose concentration | 5g vs. 10g vs. 20g sugar |
| Temperature | 20°C vs. 35°C vs. 45°C (kills yeast) |
| Yeast amount | 2.5g vs. 5g vs. 10g |
| Sugar type | Glucose, fructose, sucrose, artificial sweetener |
Step 1: Wire it up
Time: ~15 minutes
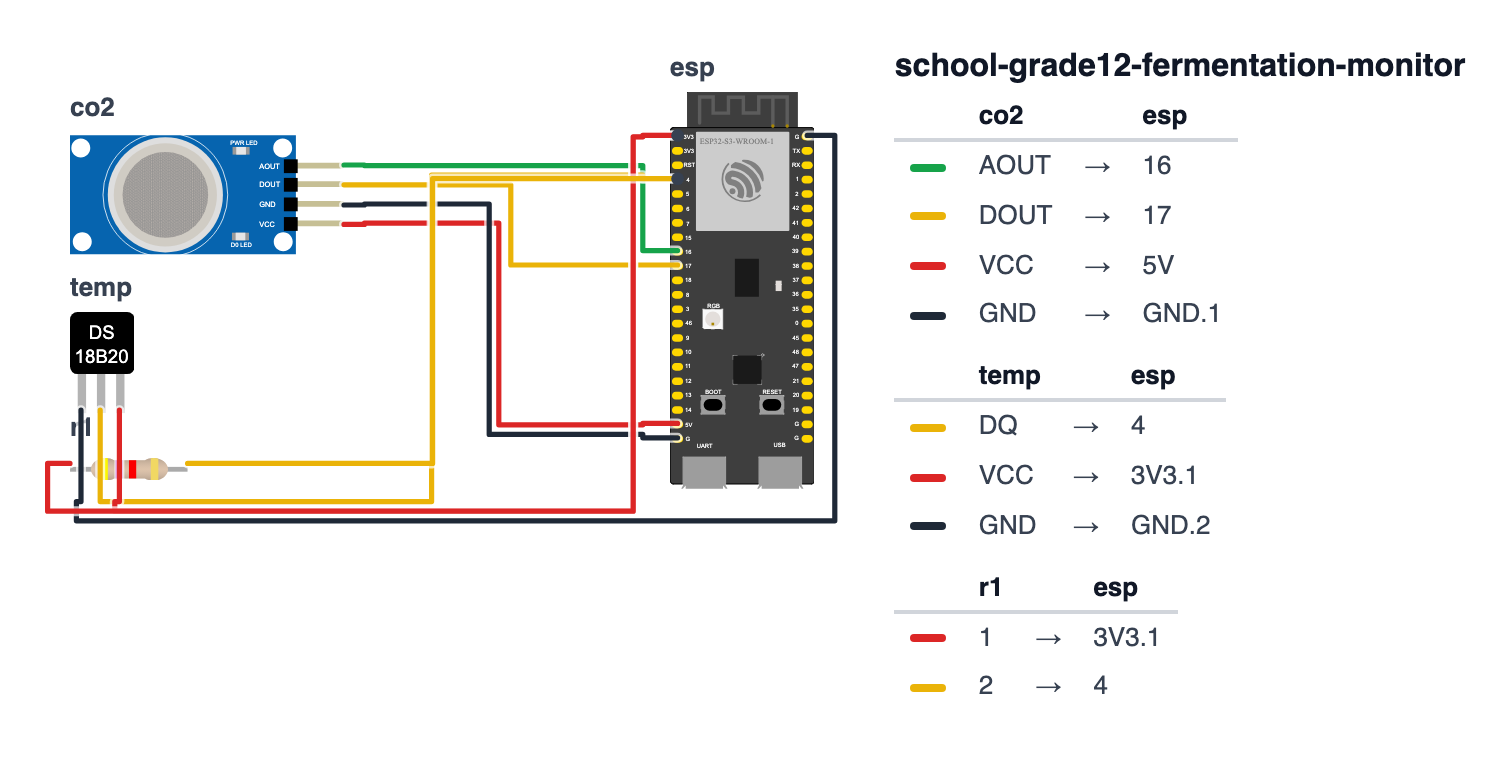
MH-Z19B (UART):
- TX (green) → GPIO16 (ESP32 RX)
- RX (blue) → GPIO17 (ESP32 TX)
- Vin (red) → 5V
- GND (black) → GND
DS18B20: 5. Red → 3.3V 6. Black → GND 7. Yellow/White → GPIO4 8. 4.7kΩ resistor between GPIO4 and 3.3V (pull-up — REQUIRED)
Check: The MH-Z19B needs 5V for its infrared heater. It will not work on 3.3V. The UART pins: MH-Z19B TX → ESP32’s RX (GPIO16), MH-Z19B RX → ESP32’s TX (GPIO17).
Step 2: Flash the code
Time: ~20 minutes
Install: MHZ19 library (by Jonathan Dempsey), OneWire, DallasTemperature
The big picture first. This program turns the ESP32 into a fermentation data logger:
- The MH-Z19B CO2 sensor connects via UART (a two-wire serial connection, like a very simple text chat between chips). It sends the CO2 reading as a number.
- The DS18B20 temperature probe connects via a protocol called OneWire — one single data wire to read temperature from a waterproof probe inside the flask.
- The ESP32 connects to WiFi and hosts a web dashboard. You tap “Start Experiment” on your phone, and it logs CO2 and temperature every 30 seconds for up to 3 hours.
- When done, tap “Download CSV” to get a spreadsheet-ready file of your entire fermentation curve.
Fill in your WiFi credentials before uploading. A program is like a recipe. Copy this entire recipe into Arduino IDE and upload it:
// ========== CHOOSE YOUR BOARD ==========
// Uncomment the line for YOUR board:
#define BOARD_S3    // ESP32-S3-DevKitC-1
//#define BOARD_C6  // ESP32-C6-DevKitC-1
// ========================================

#ifdef BOARD_S3
  #define PIN_RX      16
  #define PIN_TX      17
  #define PIN_TEMP    4
#endif
#ifdef BOARD_C6
  #define PIN_RX      21
  #define PIN_TX      20
  #define PIN_TEMP    0
#endif

#include <HardwareSerial.h>
#include <MHZ19.h>
#include <OneWire.h>
#include <DallasTemperature.h>
#include <WiFi.h>
#include <WebServer.h>

#define RX_PIN PIN_RX
#define TX_PIN PIN_TX
#define TEMP_PIN PIN_TEMP

HardwareSerial mySerial(1);
MHZ19 myMHZ19;
OneWire oneWire(TEMP_PIN);
DallasTemperature tempSensor(&oneWire);

const char* ssid = "YOUR_WIFI_NAME";
const char* password = "YOUR_WIFI_PASSWORD";
WebServer server(80);

int co2Log[360];
float tempLog[360];
unsigned long timeLog[360];
int logCount = 0;
unsigned long experimentStart = 0;
bool running = false;

int currentCO2 = 0;
float currentTemp = 0;
int baselineCO2 = 0;

void setup() {
  Serial.begin(115200);
  mySerial.begin(9600, SERIAL_8N1, RX_PIN, TX_PIN);
  myMHZ19.begin(mySerial);
  myMHZ19.autoCalibration(false);
  tempSensor.begin();

  WiFi.begin(ssid, password);
  while (WiFi.status() != WL_CONNECTED) delay(500);
  Serial.println("IP: " + WiFi.localIP().toString());

  server.on("/", []() {
    String html = "<!DOCTYPE html><html><head>";
    html += "<meta name='viewport' content='width=device-width,initial-scale=1'>";
    html += "<meta http-equiv='refresh' content='30'>";
    html += "<title>Fermentation Monitor</title>";
    html += "<style>body{font-family:sans-serif;padding:20px}";
    html += "button{padding:12px 20px;margin:5px;border:none;border-radius:6px;font-size:16px;cursor:pointer}";
    html += ".start{background:#4CAF50;color:white}.stop{background:#f44336;color:white}";
    html += "table{border-collapse:collapse;font-size:12px}td,th{border:1px solid #ddd;padding:4px 8px}</style></head><body>";
    html += "<h2>Fermentation Monitor</h2>";
    html += "<p>CO2: <b>" + String(currentCO2) + " ppm</b> | Temp: <b>" + String(currentTemp, 1) + " °C</b></p>";
    html += "<p>Status: " + String(running ? "<b>RUNNING</b>" : "Idle") + " | Points: " + String(logCount) + "</p>";
    html += "<button class='start' onclick=\"fetch('/start')\">Start Experiment</button>";
    html += "<button class='stop' onclick=\"fetch('/stop')\">Stop</button>";
    html += "<a href='/csv'><button>Download CSV</button></a>";

    if (logCount > 0) {
      html += "<h3>Data</h3><table><tr><th>Time (min)</th><th>CO2 (ppm)</th><th>ΔCO2</th><th>Temp (°C)</th></tr>";
      for (int i = 0; i < logCount; i++) {
        int dco2 = co2Log[i] - baselineCO2;
        html += "<tr><td>" + String(timeLog[i]/60.0, 1) + "</td>";
        html += "<td>" + String(co2Log[i]) + "</td>";
        html += "<td>+" + String(dco2) + "</td>";
        html += "<td>" + String(tempLog[i], 1) + "</td></tr>";
      }
      html += "</table>";
    }
    html += "</body></html>";
    server.send(200, "text/html", html);
  });

  server.on("/start", []() {
    logCount = 0;
    running = true;
    experimentStart = millis();
    baselineCO2 = myMHZ19.getCO2();
    server.send(200, "text/plain", "started");
  });

  server.on("/stop", []() {
    running = false;
    server.send(200, "text/plain", "stopped");
  });

  server.on("/csv", []() {
    String csv = "time_s,time_min,co2_ppm,delta_co2,temp_C\n";
    for (int i = 0; i < logCount; i++) {
      csv += String(timeLog[i]) + "," + String(timeLog[i]/60.0, 2) + ",";
      csv += String(co2Log[i]) + "," + String(co2Log[i] - baselineCO2) + ",";
      csv += String(tempLog[i], 1) + "\n";
    }
    server.send(200, "text/csv", csv);
  });

  server.begin();
  Serial.println("time_s,co2_ppm,temp_C");
}

unsigned long lastSample = 0;

void loop() {
  server.handleClient();

  if (millis() - lastSample > 5000) {
    lastSample = millis();

    currentCO2 = myMHZ19.getCO2();
    tempSensor.requestTemperatures();
    currentTemp = tempSensor.getTempCByIndex(0);

    if (running && logCount < 360 && millis() - experimentStart > 30000) {
      static unsigned long lastLog = 0;
      if (millis() - lastLog > 30000) {
        lastLog = millis();
        unsigned long elapsedS = (millis() - experimentStart) / 1000;
        co2Log[logCount] = currentCO2;
        tempLog[logCount] = currentTemp;
        timeLog[logCount] = elapsedS;
        logCount++;
        Serial.println(String(elapsedS) + "," + String(currentCO2) + "," + String(currentTemp, 1));
      }
    }
  }
}
Line-by-line: what every line does and why
Lines 1–6: Borrowing ready-made tools
#include <HardwareSerial.h>
#include <MHZ19.h>
#include <OneWire.h>
#include <DallasTemperature.h>
#include <WiFi.h>
#include <WebServer.h>
#include means “grab this instruction book.” Six books: HardwareSerial is the ESP32’s built-in serial communication (for talking to the CO2 sensor). MHZ19 is the library for the CO2 sensor specifically. OneWire and DallasTemperature handle the temperature probe. WiFi and WebServer handle networking.
Lines 8–10: Pin definitions
#define RX_PIN 16
#define TX_PIN 17
#define TEMP_PIN 4
RX_PIN is where the CO2 sensor’s TX wire connects (the ESP32 “receives” on this pin). TX_PIN is where the CO2 sensor’s RX wire connects (the ESP32 “transmits” on this pin). Note the cross: the sensor’s TX goes to the ESP32’s RX, because one device’s output is the other device’s input — like two people talking, one’s mouth connects to the other’s ear.
Lines 12–15: Creating sensor objects
HardwareSerial mySerial(1);
MHZ19 myMHZ19;
OneWire oneWire(TEMP_PIN);
DallasTemperature tempSensor(&oneWire);
HardwareSerial mySerial(1) creates a serial channel using the ESP32’s second hardware UART (number 1). MHZ19 myMHZ19 creates the CO2 sensor controller. OneWire oneWire(TEMP_PIN) creates the one-wire bus on pin 4. DallasTemperature tempSensor(&oneWire) creates the temperature sensor controller and tells it to use that OneWire bus. The & means “give this the address of (a reference to) oneWire.”
Lines 23–31: Data storage arrays
int co2Log[360];
float tempLog[360];
unsigned long timeLog[360];
int logCount = 0;
bool running = false;
int baselineCO2 = 0;
Three shelves with 360 slots each — enough for 3 hours at 30-second intervals (3×60×2 = 360 measurements). logCount tallies how many slots have been filled. bool running is a light switch: false = idle, true = experiment in progress. baselineCO2 stores the starting CO2 level so you can calculate ΔCO2 (change from baseline) rather than absolute ppm.
Lines 33–44: setup() — serial and sensor initialization
mySerial.begin(9600, SERIAL_8N1, RX_PIN, TX_PIN);
myMHZ19.begin(mySerial);
myMHZ19.autoCalibration(false);
mySerial.begin(9600, SERIAL_8N1, RX_PIN, TX_PIN) starts the UART at 9600 baud (the CO2 sensor’s required speed), using pins 16 and 17. SERIAL_8N1 means “8 data bits, No parity, 1 stop bit” — a standard serial format. myMHZ19.begin(mySerial) connects the CO2 library to this serial channel.
myMHZ19.autoCalibration(false) turns off auto-calibration. The sensor normally assumes the lowest CO2 reading it sees is fresh outdoor air (400ppm). In your sealed fermentation flask, CO2 builds up to thousands of ppm — without disabling this, the sensor would “recalibrate” to the wrong baseline and give false readings.
The /start web route
server.on("/start", []() {
  logCount = 0;
  running = true;
  experimentStart = millis();
  baselineCO2 = myMHZ19.getCO2();
  server.send(200, "text/plain", "started");
});
When you tap “Start Experiment” on your phone, the browser sends a request to /start. This route: resets the log counter to 0, sets running = true, records the start time, and captures the current CO2 as baseline. Now the loop starts logging data.
The /csv web route
server.on("/csv", []() {
  String csv = "time_s,time_min,co2_ppm,delta_co2,temp_C\n";
  for (int i = 0; i < logCount; i++) {
    csv += String(timeLog[i]) + "," + String(timeLog[i]/60.0, 2) + ",";
    csv += String(co2Log[i]) + "," + String(co2Log[i] - baselineCO2) + ",";
    csv += String(tempLog[i], 1) + "\n";
  }
  server.send(200, "text/csv", csv);
});
When you tap “Download CSV,” the browser visits /csv. The for loop builds one text line per data point. The result is a CSV file your browser downloads. \n is a newline character — it tells the computer to start a new row. Paste the CSV into Google Sheets to plot your fermentation curve.
Lines in loop() — the logging logic
if (millis() - lastSample > 5000) {
  ...
  currentCO2 = myMHZ19.getCO2();
  tempSensor.requestTemperatures();
  currentTemp = tempSensor.getTempCByIndex(0);
The CO2 sensor is slow — it needs a few seconds between readings. This reads it every 5 seconds and stores the current values in currentCO2 and currentTemp. requestTemperatures() asks the DS18B20 to measure. getTempCByIndex(0) picks up that measurement in Celsius (index 0 = the first probe on the bus).
static unsigned long lastLog = 0;
if (millis() - lastLog > 30000) {
  lastLog = millis();
  ...
  logCount++;
}
static means this variable survives between function calls — it’s not reset each time through the loop. The 30000ms (30 second) condition means data is only logged every 30 seconds, even though we read the sensor every 5 seconds. This limits the stored data to 360 points maximum.
The whole thing in one sentence
When powered on and connected to WiFi, the device reads CO2 and temperature continuously. When you tap Start on the web page, it records a baseline and begins logging every 30 seconds — tap Download CSV after 2+ hours to get your complete fermentation curve.
First thing to try: open the web page (IP shown in Serial Monitor) and check the live CO2 reading. It should be around 400–500ppm (outdoor air). Breathe on the CO2 sensor inlet — you exhale 40,000ppm CO2, so the reading should jump dramatically. That confirms the sensor is working.
Check: Open Serial Monitor. The CO2 reading should be around 400–500ppm (atmospheric level) before you start the experiment. If it reads 0 or 5000+, check UART wiring (TX/RX).
Step 3: Wait 2 minutes for sensor warmup
The MH-Z19B needs approximately 3 minutes after power-up before readings are stable. During this time it runs an internal calibration cycle. The LED on the sensor blinks during warmup.
Note: In your sealed jar experiment, disable auto-calibration (
myMHZ19.autoCalibration(false)) — the sensor’s auto-calibration assumes outdoor-level CO2 as baseline, which would give wrong readings in a CO2-rich sealed environment.
Step 4: Run the experiment!
Protocol:
- Mix yeast + sugar + warm water in the flask
- Seal the flask with sensor tubing attached
- Tap “Start Experiment” on the web dashboard
- Log data for 2+ hours
- Download CSV and plot in Google Sheets
What to graph:
- ΔCO2 (change from baseline) vs. time
- Temperature vs. time (same chart, secondary axis)
- Mark: lag phase (yeast activating), exponential growth phase (peak CO2 rate), stationary phase (glucose depleted)
Expected curve: CO2 starts flat (10–15 min lag while yeast activate), then rises steeply (exponential), then levels off (glucose depleted after 60–90 min at 35°C).
Presentation tip: Run the experiment during the period before your presentation so you have 2 hours of data. Show the full CO2 curve. Mark the three metabolic phases: “The lag phase took 12 minutes — that’s how long the yeast took to activate their fermentation pathways. The rate peaked at 45 minutes. By 90 minutes, CO2 production almost stopped — the glucose was exhausted.”
What just happened
The MH-Z19B is a Non-Dispersive Infrared (NDIR) sensor — it uses Beer-Lambert Law: the amount of IR absorbed is proportional to the concentration of CO2 in the light path. This is precise enough to detect the difference between outdoor air (415ppm) and a crowded room (1000ppm) or a fermenting flask (3000–5000ppm).
The fermentation curve follows Monod kinetics (for microbial growth): CO2 production rate = (maximum rate × [glucose]) / (Ks + [glucose]). As glucose depletes, rate slows. This is the same math as enzyme kinetics (Michaelis-Menten).
Curriculum connections:
- AP Biology: Cellular respiration, fermentation, enzymes, Michaelis-Menten kinetics
- NGSS HS-LS1-7: Use a model to illustrate that cellular respiration is a chemical process whereby the bonds of food molecules and oxygen molecules are broken
- AP Chemistry: Reaction kinetics, rate laws, concentration dependence
Real bioreactors in pharmaceutical manufacturing use the same CO2 monitoring principle to track bacterial or yeast fermentation for antibiotic or insulin production.
Level Up
Compare sugar types: Does the same mass of fructose, sucrose, and glucose produce the same CO2? (No — the enzyme required to cleave sucrose adds a lag step.)
Optimal temperature: Run 4 identical experiments at 20°C, 30°C, 37°C, and 45°C. Plot CO2 production rate vs. temperature. Find the optimal temperature — and the temperature where yeast die.
Ethanol sensor: Add an MQ-3 ethanol sensor ($3) to also measure the fermentation product. Plot both CO2 and ethanol simultaneously.
Troubleshooting
| Problem | Fix |
|---|---|
| CO2 reads 0 ppm | Swap RX/TX pins — MHZ19 TX → GPIO16 (ESP32 RX2). Check 5V power. Wait 3 minutes for warmup. |
| CO2 reads 5000+ (max) | Sensor is saturating — the sealed flask built up too much CO2. Open it briefly to reset, use smaller sealed volume. |
| Temperature reads -127°C | Missing 4.7kΩ pull-up resistor on DS18B20 data pin. |
| Web page not loading | Check IP from Serial Monitor. Must be on same WiFi. |
| Upload fails | Hold BOOT button while clicking Upload. |