Parent info
Parts you need
Affiliate links — we may earn a small commission
Try this circuit in your browser!
Run the code, press the buttons and watch what happens — before you buy any parts. No account needed.
Open in Simulator →Your classmates counted heartbeats with their fingers. You have a sensor.
Imagine this: Health class exercise lab. Everyone presses two fingers on their wrist, counts beats for 15 seconds, multiplies by 4. They write down “about 80 bpm.” Error margin: probably ±20%.
Your device clips to a fingertip. The OLED shows: 74 BPM. SpO2: 98%. After 20 jumping jacks: 142 BPM. Recovery time: 47 seconds back to resting.
You didn’t guess. You measured. And you can prove your hypothesis: “Heart rate recovery time correlates with fitness level.”
That’s what we’re building. For about $20.
What you’ll need
| Part | What it does | Price |
|---|---|---|
| ESP32-S3-DevKitC-1 | Brain — processes sensor data and runs the display | ~$12 |
| MAX30102 sensor | Shines red/infrared light through your finger, measures blood pulse | ~$6 |
| OLED display 0.96” | Shows BPM and SpO2 in real time | ~$4 |
| Breadboard + jumper wires | Connects everything | ~$5 |
You also need: home WiFi for data logging (optional).
Total: ~$20 | Time: ~1–2 hours | Difficulty: ●●○○○
How it works (60 seconds)
The MAX30102 uses photoplethysmography (PPG) — that’s a $10 word for “light-based heartbeat detection.” Here’s the simple version: it shines a tiny red light through your fingertip. Blood absorbs red light. When your heart pumps, more blood rushes through your finger, absorbing more light. The sensor detects that flicker — about 60–100 times per minute at rest.
It’s the same technology inside every Apple Watch and Fitbit.
The ESP32 calculates beats-per-minute from those light pulses and displays it on the tiny OLED screen.
Step 0: Design your experiment
Time: ~15 minutes (planning)
A good science experiment needs a hypothesis and a protocol. Here’s a template:
Hypothesis: “People who exercise regularly will have lower resting BPM and faster recovery to resting BPM after exercise.”
Protocol:
- Record resting BPM (sit still for 2 minutes, then measure for 30 seconds)
- Perform 20 jumping jacks
- Immediately record peak BPM
- Record BPM every 30 seconds until back to resting
- Calculate recovery time (seconds from peak to within 5 BPM of resting)
Test 3–5 people: Compare athletes vs. non-athletes, or your own data at different times of day.
Your data table:
| Person | Resting BPM | Peak BPM | Recovery Time (s) | Exercise level |
|---|---|---|---|---|
| You | ||||
| Classmate A |
Step 1: Wire it up
Time: ~10 minutes
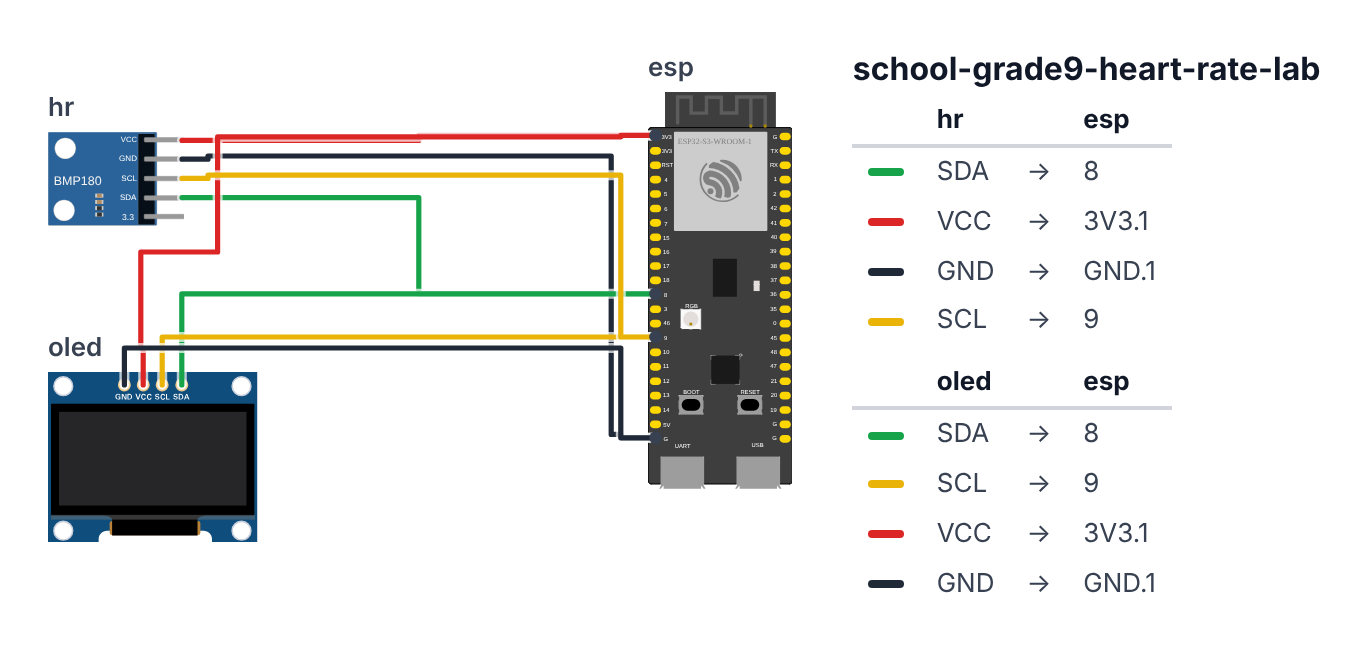
Both the MAX30102 and OLED use I2C protocol — they share the same 2 data wires but have different addresses.
MAX30102 (4 wires):
- SDA → GPIO 8 (C6: GPIO 6)
- SCL → GPIO 9 (C6: GPIO 7)
- VIN → 3.3V
- GND → GND
OLED Display (4 wires): 5. SDA → GPIO 8 (C6: GPIO 6) (same wire — I2C bus allows multiple devices) 6. SCL → GPIO 9 (C6: GPIO 7) (same wire) 7. VCC → 3.3V 8. GND → GND
Check: Both devices share GPIO 8 and GPIO 9 (C6: GPIO 6 and GPIO 7). That’s fine — I2C is a bus. Just make sure both have 3.3V power. The OLED I2C address is 0x3C, MAX30102 is 0x57 — they won’t interfere.
Good to know: The simulator has no MAX30102 part, so the wiring picture uses a similar little I2C sensor board (it says BMP180) in its place. The four wires are the same.
Step 2: Flash the code
Time: ~20 minutes
Install these libraries in Arduino IDE:
- SparkFun MAX3010x Pulse and Proximity Sensor Library (by SparkFun)
- Adafruit SSD1306 (for OLED)
- Adafruit GFX Library
The big picture first. This program is a finger-clip heart rate monitor:
- The MAX30102 sensor shines an invisible infrared light through your fingertip. Blood absorbs that light. Every heartbeat pushes more blood through your finger, causing a tiny dip in the light that comes back out.
- The ESP32 detects those dips, calculates how many happen per minute, and averages the last 4 beats for a stable reading.
- The OLED display shows the live BPM in giant numbers, plus a small
<3symbol every time a beat is detected.
A program is like a recipe. The computer reads it top to bottom and does exactly what is written, nothing more. Copy this entire recipe into Arduino IDE and upload it:
// ========== CHOOSE YOUR BOARD ==========
// Uncomment the line for YOUR board:
#define BOARD_S3    // ESP32-S3-DevKitC-1
//#define BOARD_C6  // ESP32-C6-DevKitC-1
// ========================================

#ifdef BOARD_S3
  #define PIN_SDA   8
  #define PIN_SCL   9
#endif
#ifdef BOARD_C6
  #define PIN_SDA   6
  #define PIN_SCL   7
#endif

#include <Wire.h>
#include <Adafruit_GFX.h>
#include <Adafruit_SSD1306.h>
#include "MAX30105.h"
#include "heartRate.h"

#define SCREEN_WIDTH 128
#define SCREEN_HEIGHT 64

Adafruit_SSD1306 display(SCREEN_WIDTH, SCREEN_HEIGHT, &Wire, -1);
MAX30105 particleSensor;

const byte RATE_SIZE = 4;
byte rates[RATE_SIZE];
byte rateSpot = 0;
long lastBeat = 0;
float beatsPerMinute = 0;
int beatAvg = 0;

unsigned long measureStart = 0;
bool logging = false;
int logData[120];
int logCount = 0;

void setup() {
  Serial.begin(115200);
  Wire.begin(PIN_SDA, PIN_SCL);

  if (!display.begin(SSD1306_SWITCHCAPVCC, 0x3C)) {
    Serial.println("OLED not found!");
    while (1);
  }
  display.clearDisplay();
  display.setTextColor(SSD1306_WHITE);
  display.setTextSize(2);
  display.setCursor(10, 20);
  display.println("Heart Lab");
  display.setTextSize(1);
  display.setCursor(20, 50);
  display.println("Place finger on sensor");
  display.display();

  if (!particleSensor.begin(Wire, I2C_SPEED_FAST)) {
    Serial.println("MAX30102 not found!");
    while (1);
  }

  particleSensor.setup();
  particleSensor.setPulseAmplitudeRed(0x0A);
  particleSensor.setPulseAmplitudeGreen(0);

  Serial.println("Place your finger on the sensor...");
}

void loop() {
  long irValue = particleSensor.getIR();

  if (irValue < 50000) {
    display.clearDisplay();
    display.setTextSize(1);
    display.setCursor(10, 28);
    display.println("Place finger on sensor");
    display.display();
    return;
  }

  if (checkForBeat(irValue) == true) {
    long delta = millis() - lastBeat;
    lastBeat = millis();

    beatsPerMinute = 60 / (delta / 1000.0);

    if (beatsPerMinute < 255 && beatsPerMinute > 20) {
      rates[rateSpot++] = (byte)beatsPerMinute;
      rateSpot %= RATE_SIZE;

      beatAvg = 0;
      for (byte x = 0; x < RATE_SIZE; x++) beatAvg += rates[x];
      beatAvg /= RATE_SIZE;
    }
  }

  static unsigned long lastLog = 0;
  if (millis() - lastLog > 1000 && logCount < 120) {
    lastLog = millis();
    if (beatAvg > 0) {
      logData[logCount++] = beatAvg;
      Serial.println(String(logCount) + "," + String(beatAvg));
    }
  }

  display.clearDisplay();

  display.setTextSize(3);
  display.setCursor(10, 5);
  if (beatAvg < 100) display.setCursor(25, 5);
  display.println(beatAvg);

  display.setTextSize(1);
  display.setCursor(95, 15);
  display.println("BPM");

  display.setCursor(0, 48);
  if (beatAvg < 60) display.println("Resting");
  else if (beatAvg < 100) display.println("Normal");
  else if (beatAvg < 140) display.println("Active");
  else display.println("High exertion!");

  display.setCursor(80, 48);
  display.println("n=" + String(logCount));

  if (millis() - lastBeat < 150) {
    display.setCursor(110, 0);
    display.println("<3");
  }

  display.display();
}
Line-by-line: what every line does and why
Lines 1–5: Borrowing ready-made instruction books
#include <Wire.h>
#include <Adafruit_GFX.h>
#include <Adafruit_SSD1306.h>
#include "MAX30105.h"
#include "heartRate.h"
#include means “grab this instruction book.” Note the difference: angle brackets <> look in the standard library folder; quotes "" look in the same folder as your code.
- Wire — I2C communication, the two-wire bus shared by the sensor and display.
- Adafruit_GFX / Adafruit_SSD1306 — instruction books for drawing on the OLED.
- MAX30105 — the instruction book for the heart rate sensor chip.
- heartRate — a helper book with the beat-detection math already written.
Lines 7–8: Screen size
#define SCREEN_WIDTH 128
#define SCREEN_HEIGHT 64
#define gives numbers easy names. The display is 128 dots wide and 64 dots tall. Using names instead of raw numbers makes the code easier to read.
Lines 10–11: Creating the sensor and display objects
Adafruit_SSD1306 display(SCREEN_WIDTH, SCREEN_HEIGHT, &Wire, -1);
MAX30105 particleSensor;
display is the name we give our OLED. particleSensor is the name we give the MAX30102. From now on, all commands to the display start with display. and all commands to the sensor start with particleSensor.
Lines 13–20: Boxes for the beat-detection math
const byte RATE_SIZE = 4;
byte rates[RATE_SIZE];
byte rateSpot = 0;
long lastBeat = 0;
float beatsPerMinute = 0;
int beatAvg = 0;
byte is a number from 0 to 255 — small and efficient. rates[4] is a shelf with 4 compartments that stores the last 4 BPM readings. rateSpot tracks which compartment to write next. lastBeat stores the exact millisecond when the last heartbeat happened. beatsPerMinute is the raw BPM calculated from one beat. beatAvg is the average of the last 4 — smoother and more accurate.
Lines 22–24: Logging boxes
bool logging = false;
int logData[120];
int logCount = 0;
bool holds “true” or “false” — like a checkbox. logData[120] is a shelf for 120 readings (2 minutes at one per second). logCount tracks how many have been stored.
Lines 26–55: setup() — morning routine
Wire.begin(PIN_SDA, PIN_SCL);Tell the ESP32 which legs carry the I2C bus: leg 8 is SDA (data), leg 9 is SCL (clock beat). On the C6 it’s leg 6 and leg 7.
if (!display.begin(SSD1306_SWITCHCAPVCC, 0x3C)) {
  Serial.println("OLED not found!");
  while (1);
}
“Display at house number 0x3C, are you there?” The ! means NOT. So: “if the display did NOT respond, print an error and loop forever (stop).”
display.println("Heart Lab");
display.println("Place finger on sensor");
display.display();
Show the welcome message. display.display() is the most important call — it actually pushes the picture to the screen. Everything before it was drawn only in invisible memory.
if (!particleSensor.begin(Wire, I2C_SPEED_FAST)) {
  Serial.println("MAX30102 not found!");
  while (1);
}
particleSensor.setup();
particleSensor.setPulseAmplitudeRed(0x0A);
particleSensor.setPulseAmplitudeGreen(0);
Start the heart sensor. I2C_SPEED_FAST runs the I2C bus at 400 kHz instead of the default 100 kHz — the sensor needs the extra speed for accurate readings. setPulseAmplitudeRed(0x0A) sets the red LED to low power — just bright enough to detect a finger without blinding anyone. Green LED is turned off entirely (not needed for heart rate).
Lines 57–115: loop() — runs forever
long irValue = particleSensor.getIR();Read the infrared light level coming back through your finger. Higher = more light = less blood in the way. During a heartbeat, blood floods the finger and irValue dips briefly.
if (irValue < 50000) {
  display.println("Place finger on sensor");
  display.display();
  return;
}
50000 is the threshold for “no finger here.” If the IR reading is too low, no finger is pressed on the sensor. Show a reminder message and return — which skips the rest of loop() and starts over.
if (checkForBeat(irValue) == true) {
  long delta = millis() - lastBeat;
  lastBeat = millis();
  beatsPerMinute = 60 / (delta / 1000.0);
checkForBeat() is the heart-detection function from the heartRate library — it looks for the specific dip pattern that means a beat happened. delta is the time in milliseconds between this beat and the last one. delta / 1000.0 converts to seconds. 60 / seconds_between_beats gives beats per minute. Example: if beats are 0.8 seconds apart → 60 / 0.8 = 75 BPM.
  if (beatsPerMinute < 255 && beatsPerMinute > 20) {
    rates[rateSpot++] = (byte)beatsPerMinute;
    rateSpot %= RATE_SIZE;
    beatAvg = 0;
    for (byte x = 0; x < RATE_SIZE; x++) beatAvg += rates[x];
    beatAvg /= RATE_SIZE;
  }
Only store the reading if it is between 20 and 255 BPM — otherwise it is a noise spike, not a real beat. Store it in the next shelf compartment. rateSpot %= RATE_SIZE wraps back to 0 after position 3 — the 4 compartments rotate like a conveyor belt, always keeping the newest 4 readings. Then average all 4 and store in beatAvg.
static unsigned long lastLog = 0;
if (millis() - lastLog > 1000 && logCount < 120) {
  lastLog = millis();
  logData[logCount++] = beatAvg;
  Serial.println(String(logCount) + "," + String(beatAvg));
}
static on a variable inside loop() means “remember this value between runs, do not reset it.” Once per second, save the current average BPM to the log array and print it to Serial as a CSV line. logCount++ advances the counter after storing.
display.setTextSize(3);
display.println(beatAvg);
display.setTextSize(1);
display.println("BPM");
if (beatAvg < 60) display.println("Resting");
else if (beatAvg < 100) display.println("Normal");
...
if (millis() - lastBeat < 150) {
  display.println("<3");
}
display.display();
Show the BPM in giant text (size 3). Below it: the “BPM” label, a status word, and the reading count. millis() - lastBeat < 150 means “if a beat happened less than 150 milliseconds ago” — briefly show <3 as a heartbeat indicator. Then display.display() pushes everything to the screen.
The whole thing in one sentence
When powered on, start the sensor and display a welcome (setup). Then forever, read the IR light level, detect beats, calculate BPM, average the last 4 beats, log one reading per second to Serial, and show the result on screen with a little heart symbol on each beat (loop).
First thing to try: Upload the code and place your fingertip gently on the sensor — not pressed hard, just resting. After 5–10 seconds you should see a stable BPM. Then run in place for 30 seconds and watch the number climb. Count how many seconds it takes to return to your resting number — that is your heart rate recovery time.
Check: Upload and place your finger gently on the sensor (fingertip, not side). After 5–10 seconds the BPM should stabilize. Normal resting: 60–100 BPM. If it shows 0, press more firmly. If it shows 220+, your finger is moving — hold still.
Step 3: Run your experiment
Time: ~20 minutes per person
Before the experiment:
- Sit still for 2 minutes
- Place finger, wait for stable reading (5+ seconds)
- Record resting BPM from Serial Monitor:
File → Serial Monitor → copy numbers
During exercise:
- Remove finger, do 20 jumping jacks (or run in place for 60 seconds)
- Immediately replace finger on sensor
- Record peak BPM
Recovery phase:
- Keep measuring every 30 seconds
- Recovery is complete when BPM returns within 5 of resting
- Record the recovery time
Export your data:
- The code logs to Serial as CSV:
time_seconds,BPM - Copy from Serial Monitor and paste into Google Sheets
- Make a line chart: time on X axis, BPM on Y axis
- Mark the exercise start and end with vertical lines
Step 4: Present it!
Presentation tip: Run the live demo during your presentation. Have a volunteer put their finger on the sensor. Show the live BPM on screen. Then have them do 10 jumping jacks and show the spike. Say:
“The resting heart rate and recovery curve together tell you about cardiovascular fitness. Elite athletes recover in under 60 seconds. Average teenagers take 90–120 seconds. We tested 5 people and found [your result]. The data supported our hypothesis that [athletes/non-athletes/etc.].”
Show your Google Sheets chart. Real data from real people you measured. That’s a science project.
What just happened
The MAX30102 uses optical sensing — detecting tiny changes in light absorption. The ESP32 runs a peak detection algorithm in checkForBeat() — it finds the moment blood volume peaks in your finger, which marks each heartbeat.
Curriculum connections:
- NGSS HS-LS1-3: Plan and conduct investigations to provide evidence that feedback mechanisms maintain homeostasis
- AP Biology: Homeostasis, cardiovascular system, exercise physiology
- Common Core Math: Represent and interpret data, measures of center and variation
SpO2 (blood oxygen) measurement is available in the MAX30102 too — it compares red vs. infrared absorption. Normal SpO2 is 95–100%. Anything below 90% is a medical concern. That’s how pulse oximeters at hospitals work.
Level Up
Heart rate variability (HRV): Instead of just average BPM, measure the variation between beats. High HRV = healthy nervous system. Low HRV = stress. This is what fitness trackers use to measure “recovery score.”
Stress test comparison: Compare BPM while resting vs. watching a scary video clip vs. solving a hard math problem. Do mental challenges raise heart rate?
Multiple sensors: Build 3 devices and measure 3 people simultaneously during the same exercise bout. Compare recovery curves on a single chart.
Troubleshooting
| Problem | Fix |
|---|---|
| BPM shows 0 | Press finger more firmly. Red light should glow through your fingertip. Room light interference — shade the sensor. |
| OLED not found | Check SDA on GPIO 8, SCL on GPIO 9 (C6: GPIO 6 and GPIO 7). Check 3.3V power. Try I2C scanner sketch. |
| MAX30102 not found | Same I2C wires as OLED. Check address in Wire scan. Try 3.3V power. |
| BPM jumps wildly | Keep finger still. Average of 4 readings smooths it — give it 10+ seconds to stabilize. |
| Upload fails | Hold BOOT button while clicking Upload. |