Parent info
Parts you need
Affiliate links — we may earn a small commission
Try this circuit in your browser!
Run the code, press the buttons and watch what happens — before you buy any parts. No account needed.
Open in Simulator →Your classmates made a pie chart. Yours shows 10 elections and how the map changed.
Imagine this: Government/Civics research project on elections. Everyone makes a slide deck with pie charts of the 2020 results. Party breakdown, electoral votes, done.
Your device is a portable election data terminal. Press NEXT: 2020 results with bar charts. Press again: 2016. Again: 2012. Each election shows popular vote, electoral votes, and one key insight. A second button mode switches from “by election” to “by demographic” — show how different age groups, education levels, or regions have shifted over time.
The data drives every screen. You can discuss any election in your class, pull it up in seconds, and show the trend.
That’s what we’re building. For about $22.
What you’ll need
| Part | What it does | Price |
|---|---|---|
| ESP32-S3-DevKitC-1 | Brain — stores election data, drives the display | ~$12 |
| OLED display 0.96” | 128×64 pixel display for data visualization | ~$4 |
| Push buttons ×2 | Navigate between elections/views | ~$3 |
| Breadboard + jumper wires | Wires everything | ~$5 |
Total: ~$22 | Time: ~2 hours | Difficulty: ●●●○○
How it works (60 seconds)
Election data is stored as arrays of numbers in the code — percentages, electoral votes, turnout figures. The OLED displays this as bar charts, numbers, and text. Two buttons let you navigate: one steps through elections (2000–2020), the other switches between data views (popular vote, electoral vote, demographic breakdown, key context).
All data is embedded in the firmware — no internet connection needed once it’s uploaded. The device is self-contained.
Step 0: Research your data
Time: ~45 minutes
This is the Government class part. Your data must be accurate. Use reliable sources (FEC.gov, Wikipedia, Pew Research).
Presidential election popular vote (simplified, D vs. R):
| Year | Dem% | Rep% | Winner | Electoral |
|---|---|---|---|---|
| 2000 | 48.4 | 47.9 | Bush (R) | 271 R |
| 2004 | 48.3 | 50.7 | Bush (R) | 286 R |
| 2008 | 52.9 | 45.7 | Obama (D) | 365 D |
| 2012 | 51.1 | 47.2 | Obama (D) | 332 D |
| 2016 | 48.2 | 46.1 | Trump (R) | 306 R |
| 2020 | 51.3 | 46.9 | Biden (D) | 306 D |
Pick a specific research question that your data will answer. Examples:
- “Has the popular vote winner always won? What does 2000 and 2016 tell us about the Electoral College?”
- “How has college-educated suburban voter support shifted since 2000?”
- “How does voter turnout correlate with election outcome?”
The better your question, the more interesting your dashboard.
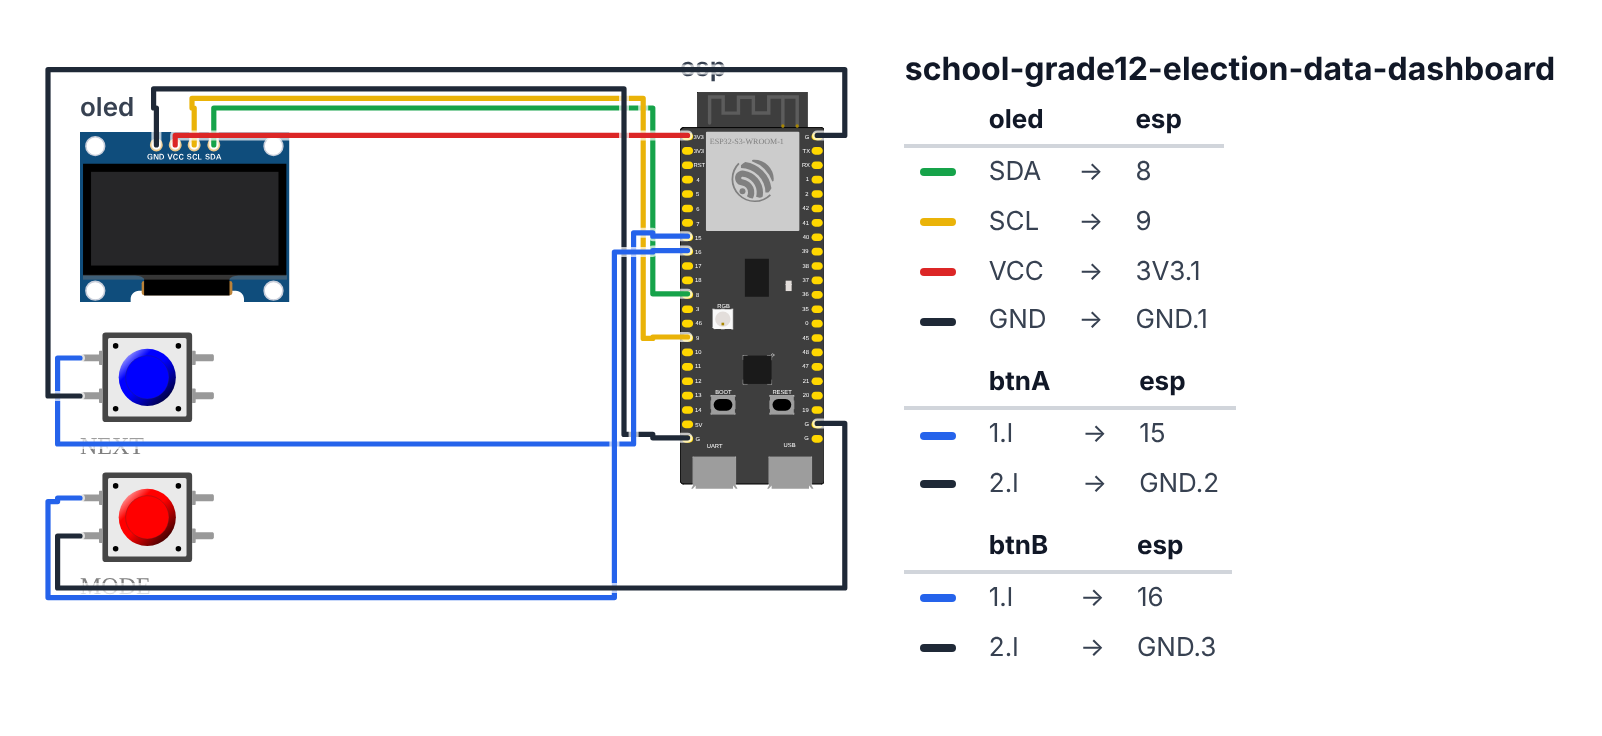
Step 1: Wire it up
Time: ~10 minutes
OLED:
- SDA → board GPIO 8 (C6: GPIO 6)
- SCL → board GPIO 9 (C6: GPIO 7)
- VCC → 3.3V
- GND → GND
Buttons: 5. Button A → board GPIO 15 (C6: GPIO 3) (next election / next view) 6. Button B → board GPIO 16 (C6: GPIO 4) (change mode)
Both buttons: one leg to GPIO, other to GND. Use INPUT_PULLUP in code.
Step 2: Flash the code
Time: ~25 minutes
Install: Adafruit SSD1306, Adafruit GFX Library
The big picture first. This program turns the ESP32 into a portable election data terminal:
- Six elections (2000–2020) are stored as arrays of numbers directly in the code — no internet needed once uploaded.
- Button A steps backward through election years. Button B cycles through four views: overview, electoral votes, demographics, key fact.
- The
drawOverview,drawElectoral,drawDemographic, anddrawKeyFactfunctions each paint a completely different screen. - All percentages are stored multiplied by 10 (48.4% = 484) so the computer can work with whole numbers and we reconstruct the decimal point when displaying.
A program is like a recipe. Copy this entire recipe into Arduino IDE and upload it:
// ========== CHOOSE YOUR BOARD ==========
// Uncomment the line for YOUR board:
#define BOARD_S3    // ESP32-S3-DevKitC-1
//#define BOARD_C6  // ESP32-C6-DevKitC-1
// ========================================

#ifdef BOARD_S3
  #define PIN_SDA    8
  #define PIN_SCL    9
  #define PIN_BTN_A  15
  #define PIN_BTN_B  16
#endif
#ifdef BOARD_C6
  #define PIN_SDA    6
  #define PIN_SCL    7
  #define PIN_BTN_A  3
  #define PIN_BTN_B  4
#endif

#include <Wire.h>
#include <Adafruit_GFX.h>
#include <Adafruit_SSD1306.h>

Adafruit_SSD1306 display(128, 64, &Wire, -1);

#define BTN_A PIN_BTN_A
#define BTN_B PIN_BTN_B

const int NUM_ELECTIONS = 6;
const int years[NUM_ELECTIONS]        = {2000, 2004, 2008, 2012, 2016, 2020};
const int demPct[NUM_ELECTIONS]        = {484, 483, 529, 511, 482, 513};
const int repPct[NUM_ELECTIONS]        = {479, 507, 457, 472, 461, 469};
const int demElectoral[NUM_ELECTIONS]  = {266, 251, 365, 332, 232, 306};
const int repElectoral[NUM_ELECTIONS]  = {271, 286, 173, 206, 306, 232};
const int turnoutPct[NUM_ELECTIONS]    = {540, 556, 618, 585, 599, 664};

const char* demCandidates[NUM_ELECTIONS] = {"Gore", "Kerry", "Obama", "Obama", "Clinton", "Biden"};
const char* repCandidates[NUM_ELECTIONS] = {"Bush", "Bush", "McCain", "Romney", "Trump", "Trump"};
const char* winners[NUM_ELECTIONS]      = {"Bush", "Bush", "Obama", "Obama", "Trump", "Biden"};
const bool demWon[NUM_ELECTIONS]        = {false, false, true, true, false, true};

const char* keyFacts[NUM_ELECTIONS] = {
  "Popular vote winner lost. 537 vote FL margin. SCOTUS stopped recount.",
  "Swift Boat controversy. Iraq War support. Ohio decided it.",
  "+9.5M new voters. First Black president. 52% women voted D.",
  "Affordable Care Act vote. 'Binders full of women' moment.",
  "Clinton +2.8M popular votes. Rust Belt shift. 3 states by <1%.",
  "Record 66.4% turnout. Mail ballots surged. Called Nov 7."
};

const int collegeDem[NUM_ELECTIONS]   = {440, 430, 470, 460, 450, 540};
const int noncollegeDem[NUM_ELECTIONS] = {410, 380, 400, 360, 290, 330};
const int blackDem[NUM_ELECTIONS]     = {910, 880, 950, 930, 890, 870};

int currentElection = 5;
int currentMode = 0;

void drawOverview(int e) {
  display.clearDisplay();

  display.setTextSize(2);
  display.setCursor(0, 0);
  display.println(String(years[e]));

  int dBar = map(demPct[e], 450, 550, 0, 80);
  int rBar = map(repPct[e], 450, 550, 0, 80);

  display.drawRect(40, 20, 85, 8, SSD1306_WHITE);
  display.fillRect(40, 20, dBar, 8, SSD1306_WHITE);
  display.setCursor(0, 20);
  display.setTextSize(1);
  display.print("D");
  display.setCursor(40 + dBar + 2, 20);
  display.println(String(demPct[e]/10) + "." + String(demPct[e]%10) + "%");

  display.drawRect(40, 32, 85, 8, SSD1306_WHITE);
  display.fillRect(40, 32, rBar, 8, SSD1306_WHITE);
  display.setCursor(0, 32);
  display.print("R");
  display.setCursor(40 + rBar + 2, 32);
  display.println(String(repPct[e]/10) + "." + String(repPct[e]%10) + "%");

  display.setCursor(0, 46);
  display.print("WINNER: ");
  display.println(winners[e]);
  display.setCursor(0, 56);
  display.print("Turnout: ");
  display.print(turnoutPct[e]/10);
  display.println("%");

  display.display();
}

void drawElectoral(int e) {
  display.clearDisplay();
  display.setTextSize(1);
  display.setCursor(0, 0);
  display.println(String(years[e]) + " Electoral");

  int dEV = map(demElectoral[e], 0, 538, 0, 118);
  int rEV = map(repElectoral[e], 0, 538, 0, 118);

  display.setCursor(0, 14);
  display.print("D: " + String(demCandidates[e]) + " " + String(demElectoral[e]));
  display.drawRect(0, 24, 128, 8, SSD1306_WHITE);
  display.fillRect(0, 24, dEV, 8, SSD1306_WHITE);

  display.setCursor(0, 36);
  display.print("R: " + String(repCandidates[e]) + " " + String(repElectoral[e]));
  display.drawRect(0, 46, 128, 8, SSD1306_WHITE);
  display.fillRect(0, 46, rEV, 8, SSD1306_WHITE);

  int line270 = map(270, 0, 538, 0, 128);
  display.drawFastVLine(line270, 23, 32, SSD1306_BLACK);
  display.drawFastVLine(line270, 23, 2, SSD1306_WHITE);
  display.drawFastVLine(line270, 53, 2, SSD1306_WHITE);
  display.setCursor(line270 - 8, 56);
  display.println("270");

  display.display();
}

void drawDemographic(int e) {
  display.clearDisplay();
  display.setTextSize(1);
  display.setCursor(0, 0);
  display.println(String(years[e]) + " Demographics");
  display.setCursor(0, 10);
  display.println("% voted Democrat:");

  auto drawBar = [](int y, const char* label, int pct) {
    display.setCursor(0, y);
    display.print(label);
    int bar = map(pct, 200, 1000, 0, 80);
    display.fillRect(45, y, bar, 7, SSD1306_WHITE);
    display.setCursor(45 + bar + 2, y);
    display.print(pct/10);
    display.println("%");
  };

  drawBar(20, "Coll.", collegeDem[e]);
  drawBar(32, "NonCo", noncollegeDem[e]);
  drawBar(44, "Black", blackDem[e]);

  display.setCursor(0, 56);
  display.println("50% = parity line");
  display.display();
}

void drawKeyFact(int e) {
  display.clearDisplay();
  display.setTextSize(1);
  display.setCursor(0, 0);
  display.println(String(years[e]) + " Key Fact:");
  display.setCursor(0, 12);

  String fact = String(keyFacts[e]);
  int lineStart = 0;
  int y = 12;
  for (int i = 0; i <= fact.length(); i++) {
    if (i == fact.length() || (fact[i] == ' ' && i - lineStart > 18)) {
      display.setCursor(0, y);
      display.println(fact.substring(lineStart, i));
      lineStart = i + 1;
      y += 10;
      if (y > 60) break;
    }
  }
  display.display();
}

void redraw() {
  switch (currentMode) {
    case 0: drawOverview(currentElection); break;
    case 1: drawElectoral(currentElection); break;
    case 2: drawDemographic(currentElection); break;
    case 3: drawKeyFact(currentElection); break;
  }
}

void setup() {
  Serial.begin(115200);
  Wire.begin(PIN_SDA, PIN_SCL);
  display.begin(SSD1306_SWITCHCAPVCC, 0x3C);

  pinMode(BTN_A, INPUT_PULLUP);
  pinMode(BTN_B, INPUT_PULLUP);

  display.clearDisplay();
  display.setTextSize(1);
  display.setCursor(15, 20);
  display.println("Election Dashboard");
  display.setCursor(20, 35);
  display.println("2000 - 2020");
  display.display();
  delay(2000);

  redraw();
}

unsigned long lastBtn = 0;

void loop() {
  if (millis() - lastBtn < 350) return;

  if (digitalRead(BTN_A) == LOW) {
    lastBtn = millis();
    currentElection = (currentElection - 1 + NUM_ELECTIONS) % NUM_ELECTIONS;
    redraw();
  }

  if (digitalRead(BTN_B) == LOW) {
    lastBtn = millis();
    currentMode = (currentMode + 1) % 4;
    redraw();
  }
}
Line-by-line: what every line does and why
Lines 1–3: Borrowing ready-made tools
#include <Wire.h>
#include <Adafruit_GFX.h>
#include <Adafruit_SSD1306.h>
#include means “grab this instruction book.” Three books cover I2C wiring, graphics, and the OLED screen. Without them we’d have to write hundreds of lines ourselves.
Lines 5–7: Button pin names
#define BTN_A PIN_BTN_A
#define BTN_B PIN_BTN_B
#define gives numbers nicknames. BTN_A (pin 15, C6: pin 3) steps through elections. BTN_B (pin 16, C6: pin 4) cycles through the four views. Using names makes it obvious which button does what.
Lines 9–16: The data arrays
const int demPct[NUM_ELECTIONS] = {484, 483, 529, 511, 482, 513};An array is like a numbered shelf. demPct[0] is 2000 (Gore’s 48.4%), demPct[5] is 2020 (Biden’s 51.3%). The values are multiplied by 10 so the computer works with whole numbers. When displaying: demPct[e]/10 gives the whole part (48), demPct[e]%10 gives the decimal digit (4), and we combine them as “48.4%”.
% is the remainder operator — like asking “what’s left over after dividing?” 484 % 10 = 4 (the remainder when dividing 484 by 10).
Lines 18–23: Text arrays
const char* winners[NUM_ELECTIONS] = {"Bush", "Bush", "Obama", "Obama", "Trump", "Biden"};
const bool demWon[NUM_ELECTIONS] = {false, false, true, true, false, true};
const char* is the type for text strings. bool is the type that holds only true or false. demWon[0] is false (Bush won 2000), demWon[2] is true (Obama won 2008). These make it easy to check the winner without comparing strings.
Lines 25–30: Key facts array
const char* keyFacts[NUM_ELECTIONS] = {
  "Popular vote winner lost...",
  ...
};
Six sticky notes, one per election. These show up in the fourth view mode. You customize these to match your specific research question.
Lines 32–37: Demographic arrays
const int collegeDem[NUM_ELECTIONS] = {440, 430, 470, 460, 450, 540};College-educated white voter Democratic support, stored × 10. 440 means 44.0%. The dramatic shift from 44% in 2000 to 54% in 2020 is visible in the data — the suburban realignment your civics class discusses.
Lines 39–40: Navigation state
int currentElection = 5;
int currentMode = 0;
currentElection = 5 starts at the most recent election (2020, index 5). currentMode = 0 starts in the overview view. Every button press changes these two variables, then redraw() paints the screen for the new combination.
Lines 42–72: drawOverview() — the main bar chart view
int dBar = map(demPct[e], 450, 550, 0, 80);
int rBar = map(repPct[e], 450, 550, 0, 80);
map() converts data values to pixel widths. The range 450–550 (representing 45%–55% vote share) maps to 0–80 pixels. This zooms in on the competitive range — a bar spanning 45%–55% shows differences clearly. A full 0%–100% scale would make all bars look nearly identical.
display.println(String(demPct[e]/10) + "." + String(demPct[e]%10) + "%");Reconstructing “48.4%” from the stored 484: integer division gives 48, remainder gives 4, string concatenation combines them with a dot.
Lines 74–100: drawElectoral() — electoral vote view
int line270 = map(270, 0, 538, 0, 128);
display.drawFastVLine(line270, 23, 32, SSD1306_BLACK);
This draws a vertical line at the 270-electoral-vote threshold — the minimum needed to win. map(270, 0, 538, 0, 128) finds where 270 out of 538 falls on the 128-pixel-wide display. The black vertical line “erases” a gap in the bars to make the threshold visible as a marker.
Lines 102–124: drawDemographic() — the lambda function
auto drawBar = [](int y, const char* label, int pct) {
  ...
};
auto and []() together define a lambda — a tiny nameless function created right here inside drawDemographic. This is convenient when you need to draw three identical-style bars with different data. Instead of writing the bar-drawing code three times, you define it once and call it three times: drawBar(20, "Coll.", collegeDem[e]).
Lines 126–145: drawKeyFact() — word wrapping
for (int i = 0; i <= fact.length(); i++) {
  if (i == fact.length() || (fact[i] == ' ' && i - lineStart > 18)) {
    display.setCursor(0, y);
    display.println(fact.substring(lineStart, i));
    lineStart = i + 1;
    y += 10;
  }
}
This is a manual word wrapper. The OLED can fit about 21 characters per line at size 1. The for loop scans character by character. When it hits a space AND has gone 18+ characters since the last line break, it prints that chunk and starts a new line. fact.substring(lineStart, i) extracts the text between two positions.
Lines 147–152: redraw() — the dispatcher
void redraw() {
  switch (currentMode) {
    case 0: drawOverview(currentElection); break;
    ...
  }
}
switch jumps to the right drawing function based on currentMode. After any button press, the main code calls redraw() — it picks the correct function automatically.
Lines 154–172: setup() and loop()
currentElection = (currentElection - 1 + NUM_ELECTIONS) % NUM_ELECTIONS;Button A goes backward. Subtracting 1 would go negative at index 0, so we add NUM_ELECTIONS first (guarantees positive), then take the remainder. Result: wraps from 2000 to 2020 when pressing back on the oldest election.
millis() - lastBtn < 350 is debouncing — prevents one button press from registering as multiple presses.
The whole thing in one sentence
The device starts at 2020 with Button A stepping backward to 2000, and Button B cycling through four views of the same election year — each press calls redraw() which selects the right drawing function for the current election and mode.
First thing to try: press Button B four times. You’ll cycle through Overview → Electoral → Demographics → Key Fact → back to Overview. Then press Button A to go back to 2000 and watch the bars change.
Step 3: Add your research question
Time: ~20 minutes
Customize the data and context labels to answer YOUR specific research question.
If your project is about the Electoral College: focus on elections where popular vote and Electoral College diverged (2000, 2016). Update keyFacts to explain the mechanism.
If it’s about demographic shift: research Pew Research data more deeply and update the collegeDem and noncollegeDem arrays. The non-college white voter shift from 41% Dem in 2000 to 33% in 2020 is dramatic and real.
Step 4: Present it!
Presentation tip: Start at 2020 (default). Say: “This is where we are today.” Press Button A to go back to 2000. “This is where we started.” Press B to switch to Electoral view. “The same data looks very different when you see electoral votes vs. popular vote.”
Walk your audience through each election year, noting the key facts. At 2016: “Clinton won the popular vote by 2.8 million. Trump won the Electoral College. That happened once before — in 2000.” Show both years’ electoral views side by side (describe them).
“My research question was: how does voter turnout correlate with outcome? The data shows that the three highest-turnout elections (2008, 2012, 2020) all resulted in Democratic wins. But causation is unclear — is high turnout helping Democrats, or are exciting Democratic candidates causing high turnout?”
Presentation tip: Let your teacher or classmates press the buttons and navigate themselves. They explore the data; you explain what they’re seeing. Interactive always beats static.
What just happened
You encoded structured research data as a queryable database on a microcontroller. The arrays are essentially a database table; the buttons are a query interface; the OLED is the output formatter.
The map() function converts data values to pixel positions — data normalization for display purposes. The bar chart is a proportional visual encoding — bar length encodes numeric value, making comparison immediate.
Curriculum connections:
- Common Core History RH.11-12.7: Integrate and evaluate multiple sources of information
- AP Government: Electoral systems, voting behavior, demographic analysis
- NGSS Science Practice 4: Analyzing and interpreting data
Political scientists use exactly these visualization techniques — partisan composition over time, demographic cross-tabs, electoral geographic analysis. Your device is a pocket version of a Pew Research data dashboard.
Level Up
Senate control history: Add a mode showing which party controlled the Senate each year — and correlate it with presidential results. When does unified government occur?
Interactive web version: Add WiFi and serve the full dataset as a web page. Use JavaScript chart library (Chart.js) for richer visualization. Let classmates browse on their phones.
Local election data: Swap the national data for your county or state’s election results. More relevant to your community.
Troubleshooting
| Problem | Fix |
|---|---|
| OLED blank | Check SDA=GPIO 8, SCL=GPIO 9 (C6: SDA=GPIO 6, SCL=GPIO 7), VCC=3.3V. Try address 0x3D. |
| Buttons not advancing | Check INPUT_PULLUP. Button to GND (not 5V). Increase debounce if double-triggering. |
| Text runs off screen | Reduce text size or shorten strings. 128 pixels / 6 pixels per char = 21 chars per line at size 1. |
| Data looks wrong | Check the × 10 convention: 51.3% is stored as 513. |
| Upload fails | Hold BOOT button while clicking Upload. |