Parent info
Parts you need
Affiliate links — we may earn a small commission
Try this circuit in your browser!
Run the code, press the buttons and watch what happens — before you buy any parts. No account needed.
Open in Simulator →Your classmates drew water cycle arrows on a poster. Yours measures it happening.
Water cycle unit. Every geography class in America draws the same diagram: sun, arrow up (evaporation), cloud, arrow down (precipitation), arrow back to ocean (collection). The arrows are the same size, the clouds are fluffy, and it doesn’t tell you anything real about rates, humidity, or what actually changes.
Your model has a DHT22 sensor measuring actual humidity changes as water evaporates from a small pan of warm water. The LED strip lights up different stages in real time: blue at the bottom for the water source, rising green for evaporation, white at the top for “clouds,” then blue again dripping down for precipitation. The OLED shows exactly what the humidity percentage is at each stage and how fast it’s changing.
You measured the water cycle. On a poster. Live.
What you’ll need
| Part | What it does | Price |
|---|---|---|
| ESP32-S3-DevKitC-1 | The brain — reads sensor and drives LED stages | ~$12 |
| DHT22 sensor | Measures temperature and humidity — tracks evaporation | ~$5 |
| WS2812 LED strip (30 LED/m, 0.5m) | 15 LEDs showing each water cycle stage | ~$6 |
| 0.96” OLED display | Shows current humidity, temperature, and stage | ~$5 |
| Breadboard + jumper wires | Connects everything | ~$5 |
Total: ~$33 | Time: ~2 hours | Difficulty: ●●●○○
How it works (60 seconds)
The DHT22 sensor measures the humidity inside your model’s enclosure. When you add warm water to the “ocean” at the bottom, humidity rises — that’s evaporation happening. The ESP32 tracks this change and updates the LED visualization: as humidity rises, the green “evaporation” LEDs light up higher and higher. When humidity is high and you cool the top of the enclosure (ice bag), water droplets form on the top — condensation — and humidity may drop back down (precipitation). The LED strip tracks this cycle in real time. You’re not drawing the water cycle. You’re watching it.
Step 0: Build your model enclosure
Time: ~30 minutes
You need a transparent enclosure to see inside AND hold humidity. Options:
Best option: A clear shoebox lid taped over a shallow container, or a clear plastic food storage container (like a medium-sized Tupperware) with the lid.
Build the inside:
- Ocean (bottom): A small waterproof container or plastic tray with a bit of warm water (1–2 cm deep)
- Land: Model clay or crumpled aluminum foil on one side
- Mountains (if you want): Cardboard triangle covered in foil
- Cloud zone (top): This is where condensation will form
Electronics placement:
- LED strip runs vertically along the back wall inside: bottom = ocean, middle = atmosphere, top = clouds
- DHT22 sensor hangs in the middle of the enclosure (the atmosphere zone)
- ESP32 and breadboard stay OUTSIDE — electronics don’t like humidity
How to run wires: Drill or poke a small hole in the side of the box. Run the DHT22 wires through the hole. Seal around the hole with clay or tape to keep humidity in.
Step 1: Wire it up
Time: ~15 minutes
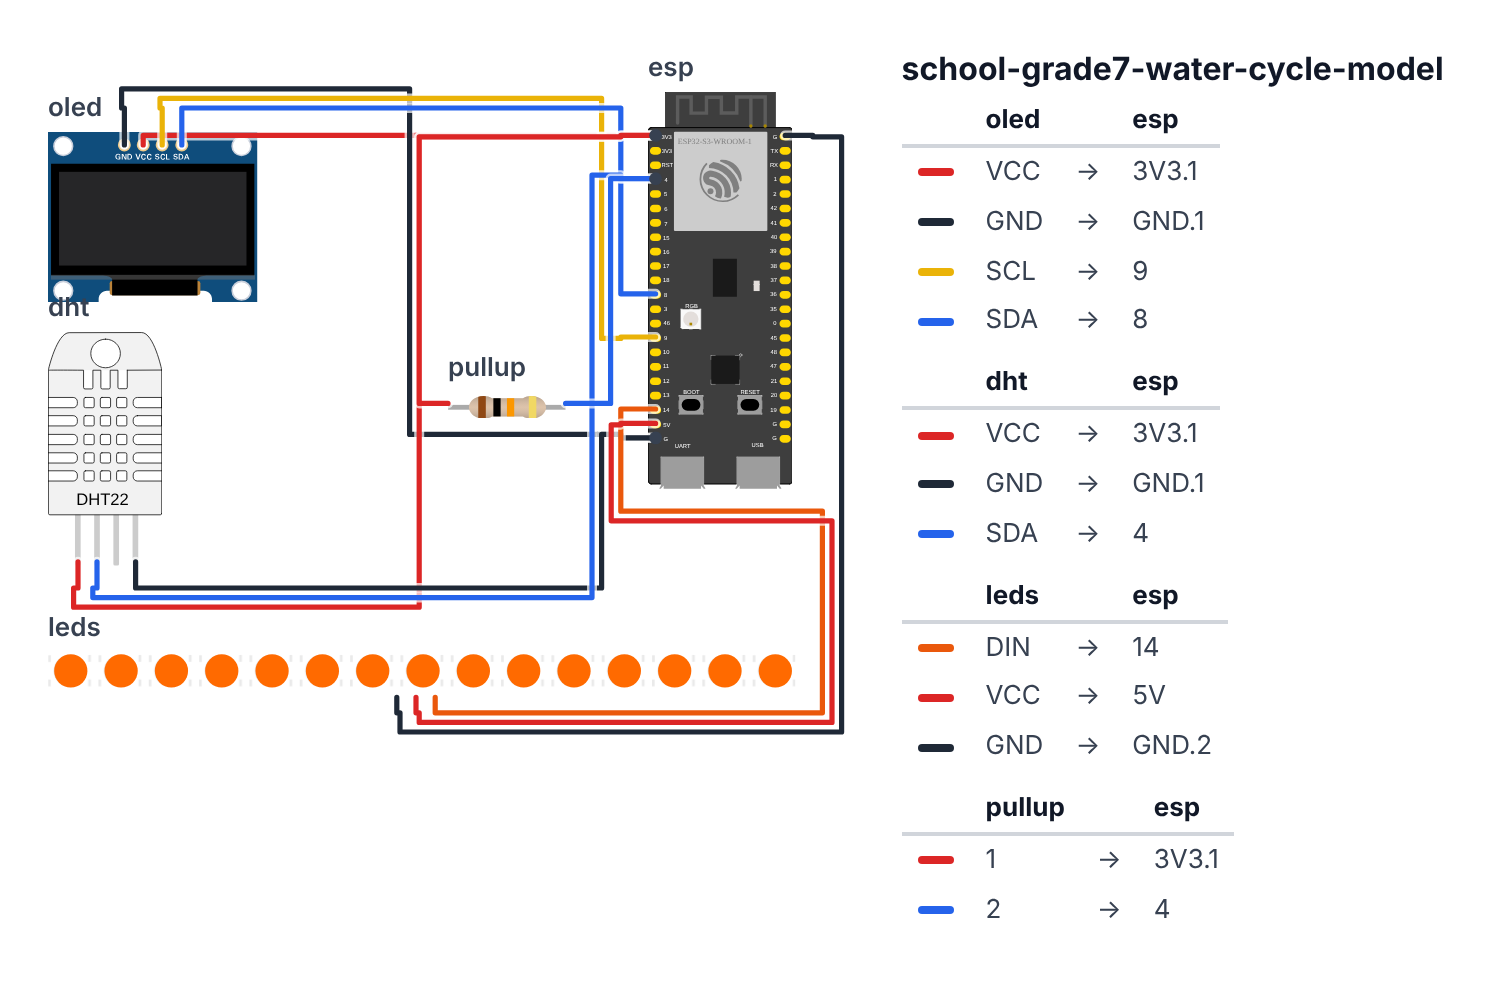
OLED Display (I2C, outside the box):
- OLED VCC → board 3.3V — red wire
- OLED GND → board GND — black wire
- OLED SCL → board GPIO 9 (C6: GPIO 7) — yellow wire
- OLED SDA → board GPIO 8 (C6: GPIO 6) — blue wire
DHT22 Sensor (inside the box, on long wires): 5. DHT22 VCC → board 3.3V — red wire 6. DHT22 GND → board GND — black wire 7. DHT22 DATA → board GPIO 4 (C6: GPIO 0) — blue wire 8. 10kΩ resistor between DHT22 VCC and DATA (required pull-up)
WS2812 LED Strip (3 wires, inside the box): 9. Strip DIN → board GPIO 14 (C6: GPIO 8) — orange wire 10. Strip 5V → board 5V — red wire 11. Strip GND → board GND — black wire
Step 2: Flash the code
Time: ~20 minutes
Install DHT sensor library, Adafruit SSD1306, Adafruit GFX, and Adafruit NeoPixel libraries.
Here is the big picture. This program turns a LED strip into a live visualization of the water cycle:
- The 15 LEDs are divided into three zones: bottom = ocean (blue), middle = atmosphere (green rising to white), top = clouds (white when humidity is high).
- The DHT22 measures humidity every 5 seconds. As humidity rises (evaporation), the atmosphere LEDs fill upward. When humidity is very high, the cloud LEDs glow.
- The program detects which stage of the water cycle is happening RIGHT NOW by comparing the current and previous humidity readings.
// ========== CHOOSE YOUR BOARD ==========
// Uncomment the line for YOUR board:
#define BOARD_S3    // ESP32-S3-DevKitC-1
//#define BOARD_C6  // ESP32-C6-DevKitC-1
// ========================================

#ifdef BOARD_S3
  #define PIN_SDA       8
  #define PIN_SCL       9
  #define PIN_DHT       4
  #define PIN_NEOPIXEL  14
#endif
#ifdef BOARD_C6
  #define PIN_SDA       6
  #define PIN_SCL       7
  #define PIN_DHT       0
  #define PIN_NEOPIXEL  8
#endif

#include <Wire.h>
#include <DHT.h>
#include <Adafruit_SSD1306.h>
#include <Adafruit_NeoPixel.h>

#define SCREEN_WIDTH 128
#define SCREEN_HEIGHT 64
Adafruit_SSD1306 display(SCREEN_WIDTH, SCREEN_HEIGHT, &Wire, -1);

#define DHT_PIN PIN_DHT
#define DHT_TYPE DHT22
DHT dht(DHT_PIN, DHT_TYPE);

#define LED_PIN PIN_NEOPIXEL
#define LED_COUNT 15
Adafruit_NeoPixel strip(LED_COUNT, LED_PIN, NEO_GRB + NEO_KHZ800);

#define OCEAN_START 0
#define OCEAN_END 2
#define ATMOS_START 3
#define ATMOS_END 10
#define CLOUD_START 11
#define CLOUD_END 14

float lastHumidity = 0;
float humidity = 0;
float temperature = 0;
int readCount = 0;
unsigned long lastRead = 0;

int animFrame = 0;

String getStage(float hum, float tempC, float prevHum) {
  float change = hum - prevHum;

  if (change > 0.5) return "EVAPORATING";
  if (hum > 85) return "CLOUDS FORMING";
  if (change < -0.5) return "PRECIPITATING";
  if (hum < 55) return "COLLECTION";
  return "STABLE ATMOSPHERE";
}

void updateLEDs(float hum, String stage) {
  strip.clear();
  animFrame++;

  for (int i = OCEAN_START; i <= OCEAN_END; i++) {
    int wave = (int)(80 + 40 * sin(animFrame * 0.1 + i * 0.5));
    strip.setPixelColor(i, strip.Color(0, 10, wave));
  }

  for (int i = ATMOS_START; i <= ATMOS_END; i++) {
    float pos = (float)(i - ATMOS_START) / (ATMOS_END - ATMOS_START);

    float fill = hum / 100.0;

    if (pos < fill) {
      int r = (int)(fill * 80);
      int g = (int)(100 * (1.0 - pos * 0.5));
      int b = (int)(80 + fill * 80);
      strip.setPixelColor(i, strip.Color(r, g, b));
    }
  }

  if (hum > 70) {
    for (int i = CLOUD_START; i <= CLOUD_END; i++) {
      int cloudBright = (int)(hum / 100.0 * 180);
      int swirl = (int)(cloudBright * 0.7 + cloudBright * 0.3 *
                        sin(animFrame * 0.15 + (i - CLOUD_START) * 1.2));
      strip.setPixelColor(i, strip.Color(swirl, swirl, swirl + 20));
    }
  }

  if (stage == "PRECIPITATING") {
    int dropPos = CLOUD_END - (animFrame % (CLOUD_END - OCEAN_START));
    dropPos = constrain(dropPos, OCEAN_START, CLOUD_END);
    strip.setPixelColor(dropPos, strip.Color(30, 30, 255));

    if (dropPos + 1 <= CLOUD_END)
      strip.setPixelColor(dropPos + 1, strip.Color(0, 0, 120));
  }

  strip.show();
}

void updateDisplay(float hum, float temp, String stage) {
  display.clearDisplay();
  display.setTextColor(SSD1306_WHITE);

  display.setTextSize(1);
  display.setCursor(0, 0);
  display.println("WATER CYCLE MONITOR");
  display.drawLine(0, 9, 128, 9, SSD1306_WHITE);

  display.setTextSize(2);
  display.setCursor(0, 12);
  display.print(hum, 0);
  display.println("% RH");

  display.setTextSize(1);
  display.setCursor(0, 32);
  display.print("Temp: "); display.print(temp, 1); display.println("C");

  display.setCursor(0, 44);
  display.print("Stage: ");
  if (stage.length() > 15) stage = stage.substring(0, 15);
  display.println(stage);

  display.setCursor(0, 56);
  display.print("Readings: "); display.print(readCount);

  display.display();
}

void setup() {
  Serial.begin(115200);
  Wire.begin(PIN_SDA, PIN_SCL);

  strip.begin();
  strip.setBrightness(80);
  strip.clear();
  strip.show();

  dht.begin();

  if (!display.begin(SSD1306_SWITCHCAPVCC, 0x3C)) {
    while (true);
  }

  display.clearDisplay();
  display.setTextColor(SSD1306_WHITE);
  display.setCursor(0, 0);
  display.println("Water Cycle Model");
  display.println("Warming up...");
  display.println("(30 second wait)");
  display.display();

  delay(2000);

  Serial.println("Water Cycle Monitor Ready");
  Serial.println("Reading#,Temp(C),Humidity(%),Stage");
}

void loop() {
  unsigned long now = millis();

  if (now - lastRead >= 5000) {
    float newTemp = dht.readTemperature();
    float newHum = dht.readHumidity();

    if (!isnan(newTemp) && !isnan(newHum)) {
      lastHumidity = humidity;
      temperature = newTemp;
      humidity = newHum;
      readCount++;

      String stage = getStage(humidity, temperature, lastHumidity);

      Serial.print(readCount); Serial.print(",");
      Serial.print(temperature, 1); Serial.print(",");
      Serial.print(humidity, 1); Serial.print(",");
      Serial.println(stage);

      updateDisplay(humidity, temperature, stage);
    }

    lastRead = now;
  }

  if (humidity > 0) {
    String stage = getStage(humidity, temperature, lastHumidity);
    updateLEDs(humidity, stage);
  }

  delay(50);
}
Line-by-line: what every line does and why
Lines 16–23: The LED zones
#define OCEAN_START 0
#define OCEAN_END 2
#define ATMOS_START 3
#define ATMOS_END 10
#define CLOUD_START 11
#define CLOUD_END 14
These six numbers divide the 15-LED strip into three sections. LEDs 0–2 are the ocean. LEDs 3–10 are the atmosphere (8 LEDs tall). LEDs 11–14 are the clouds. By naming them, the code becomes readable: for (int i = OCEAN_START; i <= OCEAN_END; i++) means “for each ocean LED.”
Lines 25–32: Current and previous humidity
float lastHumidity = 0;
float humidity = 0;
The program keeps TWO humidity values: humidity (current) and lastHumidity (previous reading). The difference between them tells the program whether humidity is rising (evaporating) or falling (precipitating). This is how you detect change — not just a snapshot, but a trend.
Lines 36–44: getStage() — reading the water cycle
float change = hum - prevHum;

if (change > 0.5) return "EVAPORATING";
if (hum > 85) return "CLOUDS FORMING";
if (change < -0.5) return "PRECIPITATING";
if (hum < 55) return "COLLECTION";
return "STABLE ATMOSPHERE";
This function decides which stage of the water cycle is happening right now, based on two clues: the current humidity level AND whether it’s going up or down. The return statements act like early exits — as soon as one condition matches, the function gives back that stage name and stops checking. The order matters: evaporation is checked before cloud forming.
Lines 46–88: updateLEDs() — the visual water cycle
Ocean section:
int wave = (int)(80 + 40 * sin(animFrame * 0.1 + i * 0.5));
strip.setPixelColor(i, strip.Color(0, 10, wave));
Blue LEDs at the bottom. sin(animFrame * 0.1 + i * 0.5) creates a gentle wave animation — each LED gets a slightly different phase (i * 0.5), so they ripple instead of all blinking together.
Atmosphere section:
float pos = (float)(i - ATMOS_START) / (ATMOS_END - ATMOS_START);
float fill = hum / 100.0;
if (pos < fill) { ... light this LED ... }
pos is the height of this LED in the atmosphere (0.0 = bottom, 1.0 = top). fill is humidity as a fraction (0.0–1.0). The LED only lights up if it’s below the current humidity level. So at 40% humidity, only the bottom 40% of atmosphere LEDs light. At 90%, almost all atmosphere LEDs light. The color blends from green-blue (low) to near-white (high saturation) as humidity increases.
Cloud section:
if (hum > 70) {
  int swirl = (int)(cloudBright * 0.7 + cloudBright * 0.3 * sin(...));
  strip.setPixelColor(i, strip.Color(swirl, swirl, swirl + 20));
}
Clouds only appear when humidity exceeds 70%. Equal red, green, and blue makes white/grey. The sin() swirl animation makes the cloud “breathe.” swirl + 20 adds a slight blue tint — real clouds look slightly blue-white.
Precipitation:
int dropPos = CLOUD_END - (animFrame % (CLOUD_END - OCEAN_START));animFrame % (CLOUD_END - OCEAN_START) counts from 0 upward and wraps — like counting 0,1,2,3,4,5,0,1,2,3… Subtracting from CLOUD_END reverses it so the drop falls downward. A bright blue pixel falls from cloud to ocean, with a dimmer trailing pixel behind it.
Lines 90–109: updateDisplay() — the OLED dashboard
if (stage.length() > 15) stage = stage.substring(0, 15);Stage names like “STABLE ATMOSPHERE” are 18 characters long. The OLED can fit 15 characters at text size 1. substring(0, 15) cuts the string to the first 15 characters. Without this, text would overflow off-screen.
Lines 124–145: loop() — two timers at once
if (now - lastRead >= 5000) { ... read sensor ... }
...
if (humidity > 0) { updateLEDs(humidity, stage); }
delay(50);
Two separate timing loops run simultaneously. The sensor reads every 5 seconds (DHT22 maximum speed). The LEDs animate every 50ms (20 frames per second) for smooth motion. By using timestamps instead of delay(), both timers run independently — the animation stays smooth even while waiting for the next sensor read.
The whole thing in one sentence
The water cycle monitor reads humidity every 5 seconds, decides which stage is happening based on whether humidity is rising or falling, and animates the LED strip to show the ocean, atmosphere, and clouds — with the height of the atmosphere section reflecting the actual humidity percentage.
First thing to try: Put a small cup of warm water next to the DHT22 sensor and close the enclosure. Watch the OLED reading rise slowly — that’s real evaporation happening. The atmosphere LEDs should fill upward as humidity climbs.
Check: After uploading, the OLED should show humidity and temperature. The LED strip should show blue ocean (bottom), green atmosphere, white cloud zone (top). Breathe into the enclosure — humidity should rise, and the atmosphere LEDs should light up higher. When humidity is above 85%, the cloud zone LEDs glow white.
Step 3: Run the water cycle experiment
Time: ~20 minutes
- Put a small dish of warm water inside the enclosure. Close the lid.
- Watch the humidity reading on the OLED — it should slowly rise (evaporation).
- Observe the LED strip: green atmosphere LEDs fill up from bottom as humidity rises.
- When humidity is very high (80%+), place a small bag of ice on top of the closed enclosure.
- Condensation forms on the cold top surface — water droplets appear.
- Humidity may drop slightly as water condenses out of the air (precipitation).
Log readings every 5 minutes for 30 minutes. This is your data for the project.
What just happened
Concepts you measured:
- Evaporation — when liquid water turns to water vapor. Your humidity sensor showed this as a rising percentage.
- Condensation — when water vapor cools and turns back to liquid. The ice experiment caused this.
- Relative humidity (RH) — the percentage of water vapor in air relative to the maximum it can hold at that temperature. At 100% RH, air is saturated — any more moisture and it rains.
- Dew point — the temperature at which RH hits 100% and condensation begins. Real weather apps show this value.
Curriculum alignment: NGSS MS-ESS2-4 (Develop a model to describe the cycling of water through Earth’s systems driven by energy from the sun and the force of gravity). Also MS-ESS2-6 (Develop and use a model to describe how unequal heating and rotation of the Earth cause patterns of atmospheric and oceanic circulation).
Presentation tip: Run the experiment DURING your presentation — add warm water at the start and let the class watch the humidity rise live on the OLED while you explain evaporation. When humidity is high, bring out your ice and show condensation forming. Real-time science demonstrations create moments your class won’t forget.
Level Up
Two zones: Add a second DHT22 sensor (different I2C address or different GPIO) near the “cloud” zone. Compare humidity at ground level vs. cloud level. Do they differ? Why?
Temperature gradient: Add a thermometer at the bottom (water) and at the top (cold zone). The temperature difference drives evaporation and condensation — you’ll see this in the data.
Full LED ring cloud: Connect the LED ring in the “cloud” area inside the model. Program it to light up like a thundercloud when humidity is very high, with lightning flashes.
★★ You completed: Grade 7 Water Cycle Model!
Troubleshooting
| Problem | Fix |
|---|---|
| DHT22 always reads “nan” | Add 10kΩ pull-up resistor between VCC and DATA. Essential for DHT22 reliability. |
| Humidity won’t rise even with warm water | Make sure the enclosure is mostly sealed. Gaps allow humid air to escape and dry air to enter. |
| LEDs show wrong stages | Adjust the thresholds (70, 85, etc.) based on your room’s baseline humidity. Start the device in an open room and note the baseline. |
| Strip doesn’t light | Check 5V (not 3.3V) on strip VCC. Check DIN vs DOUT direction. |
| Display shows no changes | DHT22 reads once every 5 seconds minimum. Wait at least 10 seconds between changes. |